LDP2 Preferred Strategy
6.0 Growth and Spatial Approaches – Options Analysis
Introduction
6.1 A range of different options and approaches have been assessed to identify the most appropriate overarching strategy for LDP2 in terms of the scale and broad locations for growth in Swansea to 2038.
6.2 The starting point for this process was to re-evaluate the approach taken in the existing Swansea LDP 2010-2025 alongside a review of the evidence base that informs that approach. This was then supplemented by a review of the very latest context and newest available evidence, including the most up to date assessment of the form and function of settlements across the County (as described in the previous chapter). As such, the potential options and approaches considered for the Preferred Strategy reflected all relevant changes in circumstances and were genuine, reasonable and sustainable possibilities. Due regard is also given to the LDP Review Report.
6.3 The 'Options for Growth and Spatial Approaches' paper December 2024 (see Appendix A) provides details of the full range of options and approaches considered. This sets out how the analysis of all the options was carried out against the key considerations set out in the Development Plans Manual, and also describes how inputs received from consultees and stakeholders during the pre-deposit engagement exercises has shaped decision making, as well as the findings from the ISA.
6.4 Reference should also be made to the extensive engagement undertaken, including the publication of 2 Technical Papers in May 2024, namely: 'Key Issues, Vision, and Objectives' and 'Growth Scenarios and Spatial Approaches'. The Background Paper 'Starting the Conversation on LDP2: Engagement Report, December 2024' should also be referred to.
Growth Level Options
6.5 A comprehensive and independent assessment of demographic and jobs led growth scenarios has been undertaken, having regard to the range of data sets available and based on a review of the latest circumstances and relevant factors that could affect growth in Swansea. The supporting Background Paper 'Economic and Housing Growth Assessment, July 2024' (see Appendix A), sets out the methodology and full context of this important analysis that underpins the Preferred Strategy. It sets out the details of four options that were identified with reference to the various data sources available and describes the key assumptions on which they are based. These four scenarios produce a range of potential development requirements to accommodate the resulting housing and job growth, which are summarised in the table below:
Table 3 Housing and Job Growth Options
|
Homes |
Homes |
Jobs |
|
|
1. Baseline economic forecast |
514 |
7,710 |
7,875 |
|
2. Long-term population growth trend |
562 |
8,430 |
8,085 |
|
3. WG principal population projection |
634 |
9,510 |
8,415 |
|
4. Higher economic growth |
634 |
9,510 |
10,238 |
|
Comparisons… |
|||
|
Average housing delivery 2010-23 |
485 |
7,275 |
6,480 |
|
WG Low variant population projection |
416 |
6,240 |
6,480 |
|
WG High variant population projection |
801 |
12,015 |
10,350 |
|
Adopted LDP requirement 2010-25 |
1,040 |
15,600 |
13,600 |
6.6 The starting point for the options considered was the most recent 2018-based Welsh Government (WG) projections for Swansea, which suggest a range of growth depending on the fertility, life expectancy and migration assumptions used. Detailed analysis of these options led to the principal WG projection being initially identified as most appropriate (option 3 in the table). This projection based its assumptions on the demographic trends that were then believed to be occurring over the preceding five years (2013-18), providing an indication of how the population of Swansea could change if these trends were to continue. This suggests growth of 9,510 dwellings over the Plan period and would support an increase of 8,415 jobs[2].
6.7 It is critical however that the WG projections are treated as a starting point, and that they are interrogated to consider whether any other evidence or material factors indicate that an alternative option should be taken forward.
6.8 Importantly, the 2018-based Welsh Government (WG) projections were published in 2020 and were based on the period before the COVID pandemic and ahead of the 2021 Census. Subsequent revisions have been made by the ONS to the inter-census mid-year estimates of population. Significantly, the ONS' latest estimate suggests that the population in mid-2022 was at least 3% below that envisaged by any of the three WG population projections. A detailed review of the post census ONS mid-year estimates enabled a more up to date position on population levels, births and deaths to be established, and also to generate an additional trend-based projection utilising the latest available demographic data. From this analysis, a longer-term population growth trend scenario (option 2) has been identified, which projects forward based on a much longer historic period (2001/02 – 2021/22) and uses the more current Census data. This suggests growth of 8,430 dwellings over the Plan period which would support the growth of 8,085 jobs.
6.9 In addition to demographic trend based projections, it is also important to consider how the economy could drive change by understanding the likely increase in population resulting from expected job growth over the Plan period. As a starting point for analysis, baseline econometric forecasts have been considered, which take a long-term view of future employment growth in Swansea, based on assumptions derived from global and national data.
6.10 Following analysis, a Cambridge Econometrics forecast has been used to form a jobs led baseline economic forecast (option 1). Modelling has been used to understand how this level of employment growth could impact on the changing size of the population, integrating reasonable labour-force behaviour assumptions[3]. This suggests, following the conversion of the resulting population to households and subsequently dwellings, growth of 7,710 dwellings over the Plan period to support employment growth of 7,875 jobs.
6.11 It should be noted that this baseline forecast does not take account of specific local circumstances in Swansea; it simply provides a nationally derived benchmark with which local data and perspectives can be triangulated. Therefore, a further jobs led higher economic growth scenario (option 4) has been developed which includes positive adjustments based on local knowledge of the latest economic impact forecasts for pipeline projects regarded as having a realistic level of certainty of coming to fruition, while also balancing this optimism with wider uncertainty and risks. This suggests growth of 9,510 dwellings over the Plan period to support employment growth of 10,238 jobs.
6.12 Table 3 above also highlights other potential scenarios for comparison purposes. One of these is a scenario based on recent historic rates of housing delivery, which averaged 485 per annum in 2010-2023. This 'dwelling-led' scenario would correspond to a lower level of population growth than the latest evidence is projecting and would be associated with reduced levels of employment growth than forecasted. Projecting forward based on previous recorded levels of housebuilding is therefore not considered to represent a credible option to support future economic growth as when modelled, this level of housing delivery would not sustainably support a sufficient demographically generated labour force needed to support even the baseline level of economic growth and could as a result have implications for increasing levels of in-commuting and would not support the LDP's vision and objectives.
6.13 Table 3 also highlights a scenario using the lower variant WG population projections as a point of comparison. This generates an even lower level of housing growth, which is similarly not a credible or reasonable option.
6.14 Conversely, the higher variant WG population projection has also been considered. This has been discounted on the basis that it would require a level of housing development that is significantly in excess of any past trends of delivery levels and analysis demonstrates it is not a realistic or achievable scale of growth having regard to the constraining factors that apply. Furthermore, analysis has shown that the higher variant WG population projection would only provide a population profile sufficient to support a similar number of new jobs as the higher economic growth scenario. However, it is actually significantly in excess in terms of the requirement for new homes of what has been shown to be necessary to support the expected upper level jobs growth forecast. The higher economic growth scenario takes into account more up to date demographic data and draws upon longer-term trends and analysis of this scenario has shown that due to the resulting differing age profiles in that scenario and the higher variant WG population projection, the upper forecasted level of jobs growth (which is an investment-led scenario and is entirely adjusted on the upside) can be achieved with much less population growth and resulting need for new homes. Therefore, adopting the higher variant WG population projection would not provide an integrated and sustainable employment and housing growth strategy.
6.15 The growth options shown in the table generate a relatively narrow range of requirements for additional employment land for 'B Class' Uses, including General Industrial, Warehousing and Office uses. These requirements range from 11 hectares at the lower end up to an upper level of 25 hectares to fully support the Higher economic growth option.
Spatial Approach Options
6.16 Alongside making decisions around the scale of future growth in Swansea, a key decision is deciding how that growth should be spatially distributed and where new development should be focussed to deliver that growth. In line with guidance, a number of spatial approaches were developed set out in the context of emerging key issues, vision and objectives the LDP2 needed to address having regard to Swansea's distinct geography.
6.17 Growth requirements are not only met by new allocations for development. There will be existing commitments with planning permission as well as 'windfall' sites that can contribute to the delivery of new homes and employment accommodation. All of these aspects require consideration.
6.18 The existing LDP Strategy is based on the creation of a limited number of sustainable new neighbourhoods at Strategic Development Areas within, or close to the defined boundaries. This is supported by a limited number of non-strategic medium scale edge of settlement extensions and more dispersed and smaller allocations. This included small scale appropriate development to provide Affordable Housing for Local Needs in rural and semi-rural settlements where the existing character and cohesion of the community will be maintained or improved by development.
6.19 There are a range of approaches that could be taken in respect of the sorts of locations where new development should be focused to deliver on the housing and employment growth aspirations for LDP2.
6.20 Having regard to the spatial strategy of the current LDP, and the updated key issues, objectives, vision, context, and strategic policy issues that have been identified, the following five potential spatial approaches were identified and were subject to consultation as part of the 'Starting the Conversation on LDP2' exercise. The Strategic Placemaking Focus option is considered largely to reflect the current strategy and therefore offers the opportunity to consider whether it remains appropriate in the current context:
- Urban/Brownfield focus;
- Strategic Placemaking focus;
- Dispersal focus;
- Highly Connected Communities focus, and
- Housing Need Clustering focus.
6.21 A summary of each of these spatial approaches is set out over the next few pages. A more detailed review and analysis of these approaches is set out in the 'Options for Growth and Spatial Approaches' Paper (December 2024) - see Appendix A.
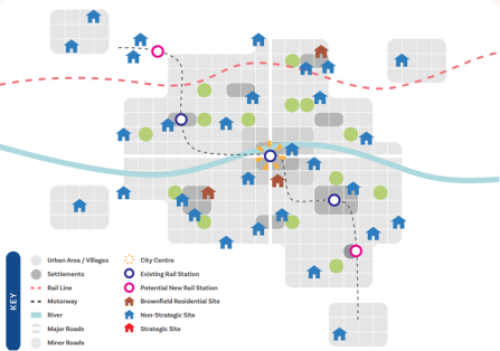
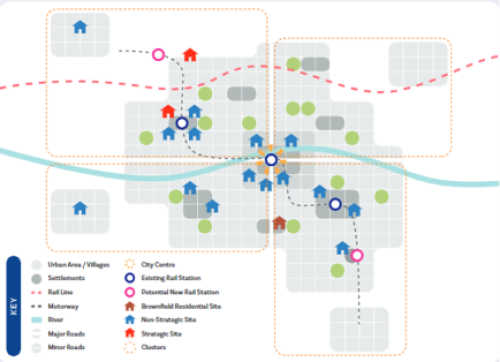
Figure 4 Potential Spatial Approaches
Urban / Brownfield
- Focus development solely on Urban Centres, villages and on brownfield land along with any existing greenfield commitments
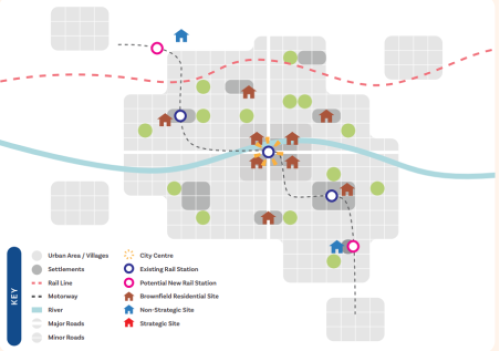
Strategic Placemaking
- This approach is reflective of the existing strategy of the LDP with a focus on a significant number of strategic sites at key locations including on the edge of the urban area for both residential and mixed- use development. This is also considered to represent the 'business as usual' – Adopted LDP 2010-2025 option.
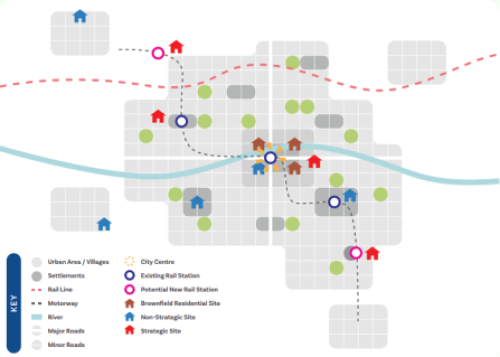
Dispersal
- This approach would focus on a higher number of smaller scale sites and a much more dispersed approach to growth across the County.
Highly Connected Communities
- This approach would focus development on highly connected sustainable sites that would promote a reduction in car use
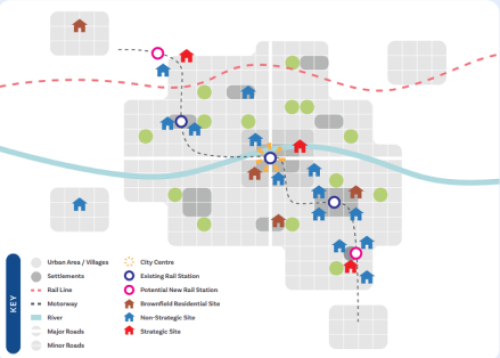
Housing Need Clustering
- This approach would focus development in areas to meet greatest identified housing need as defined by the Local Housing Market Assessment.
Preferred Level of Growth and Spatial Approach
6.22 Having regard to the options assessed the preferred way forward is set out in chapter 7 ' A Placemaking strategy for Abertawe 2038' and is based on the following:
- 6.22.1 - We have selected the Higher economic growth scenario in Table 3 above requiring 9,510 dwellings over the plan period to support employment growth of 10,238 jobs. This scenario includes positive adjustments based on local knowledge of the latest economic impact forecasts for pipeline projects regarded as having a realistic level of certainty of coming to fruition, while also balancing this optimism with wider uncertainty and risks. It represents a positive and ambitious job creation target reflective of local planned investments including strategic opportunities recognising Swansea's strategic location at the heart of the national growth area. It also represents an ambitious yet deliverable level of housing growth representing an uplift on past building rates to contribute to market and significant affordable housing needs;
- 6.22.2 - We have selected a spatial approach that is a hybrid of options considered, particularly in regard to strategic scale placemaking for sustainable neighbourhoods and delivering highly connected communities approaches (in Figure 4 above) but also recognising and reflecting some of the strongest features of the other 3 approaches.
6.23 In summary, a number of different approaches to growth and spatial distribution have been considered, consulted upon, and assessed (including through the ISA process). The preferred overall approach has emerged from such deliberations, and offers a robust and sound approach that will deliver the Plan's objectives whilst also offering a suitable level continuity from the approach that was set out within the Adopted LDP. The ISA process has played a key iterative role in this regard and has confirmed that the preferred overall approach (both in terms of growth and spatial distribution) is the most appropriate.
6.24 Further detail in how the preferred option was arrived at, including how it aligns with the Plan's objectives, is set out in the Options for Growth Background paper (December 2024).
[2] Population has been converted into households using membership rates derived from the official 2018-based projections with an adjustment for younger households which sees a partial return to the trend of the earlier 2008-based projections. A vacancy rate of 3.1% (based on the WG Council Taxbase data for 2023/24) has been applied to convert households into dwellings. In converting people in 'employment' to a jobs figure, the modelling applies a double-jobbing assumption (recognising that a small proportion of people will have more than one job). The relationship between population growth and the level of jobs supported is influenced by the projected age profile of the population. This varies between the demographic and employment-led projections thereby explaining why similar levels of population growth can be estimated to support differing levels of jobs growth.
[3] The modelling assumes a fixed commuting ratio of 0.92 derived from the latest available WG commuting data (2022); economic activity rates for those of working age are derived from the 2011 Census and adjusted based on OBR forecasts; unemployment is fixed at 4.5% over the projection period based on the trend in the past five reported years of the Annual Population Survey (2018-22).